
This is a daily analysis by CoinDesk analyst and Chartered Market Technician Omkar Godbole.
Bitcoin (BTC) remains susceptible to further downside, having lost over 7% since hitting record highs above $124,000 on Thursday.
Bullish momentum fading
The weekly chart (candlestick format) shows that BTC’s ongoing decline follows repeated bull failure to secure a foothold above $122,056, the Fibonacci golden ratio. It also marked the inability to keep gains above the significant long-term resistance trendline that connects the bull market highs of 2017 and 2021.
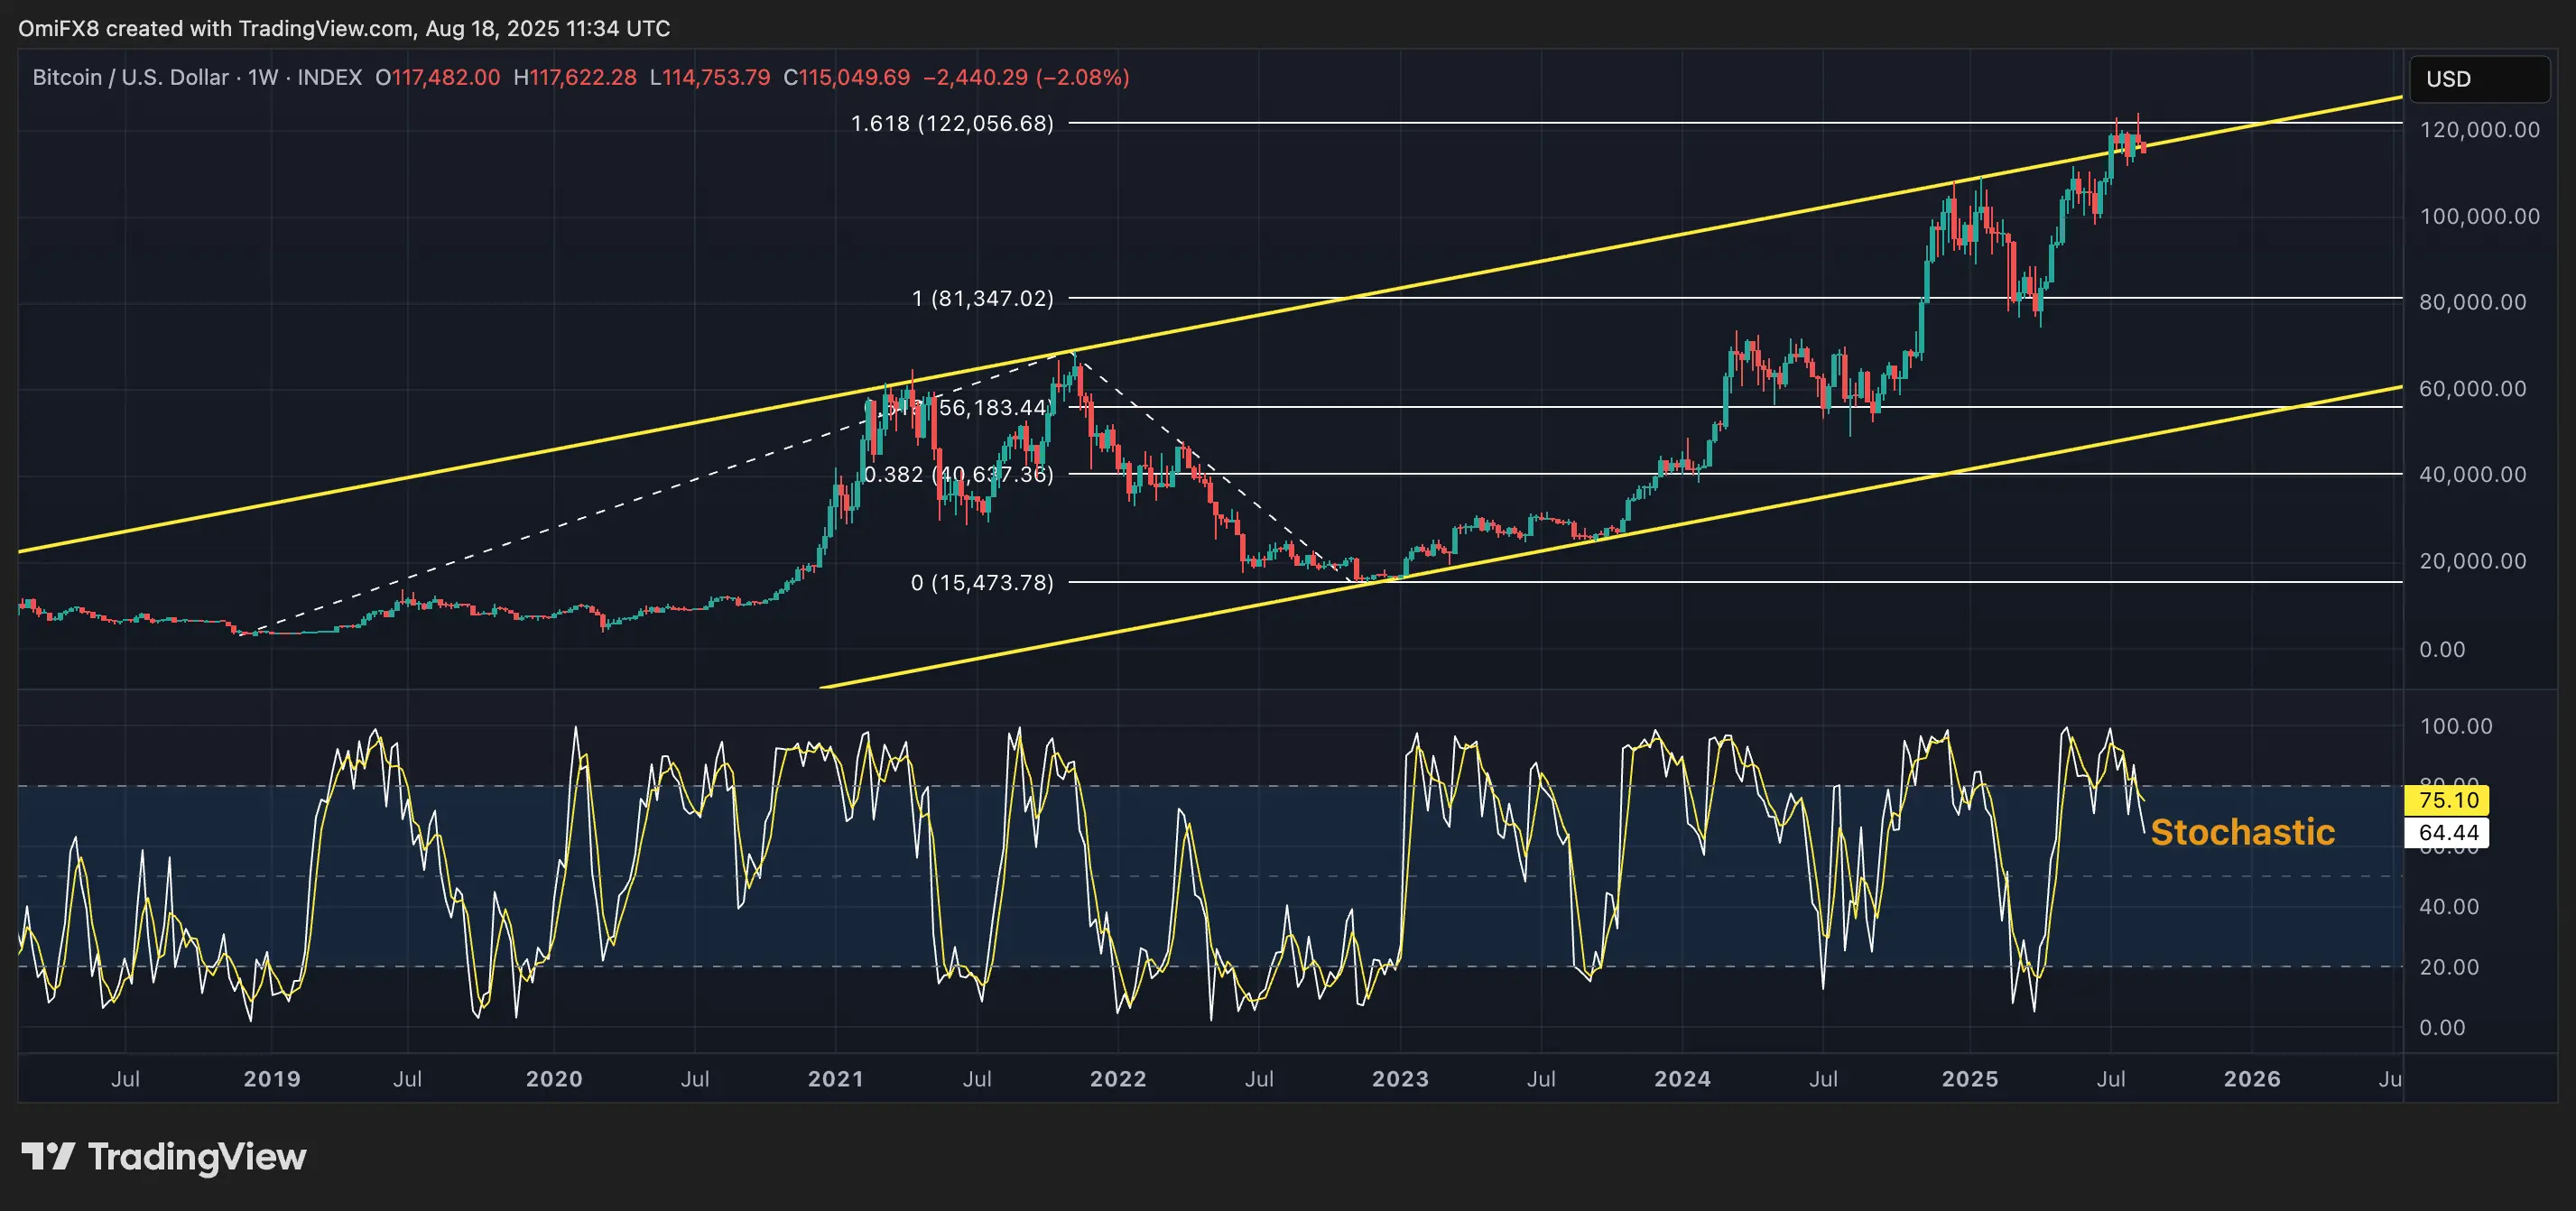
Additionally, the weekly stochastic oscillator has rolled over from the overbought zone above 80, signaling a potential correction ahead.
📖 Related Reading
- 📰 CFTC’s Goldsmith Romero says commissioner exodus ‘not a great situation’
- 📰 Ether Eyes Biggest Monthly Gain Since 2022 as ETFs, Corporate Treasuries Drive Rally
Daily chart
On the daily chart, BTC’s latest candle has broken below the bullish trendline extending from April lows, following Friday’s bearish outside-day candle that signaled a potential shift toward seller dominance.
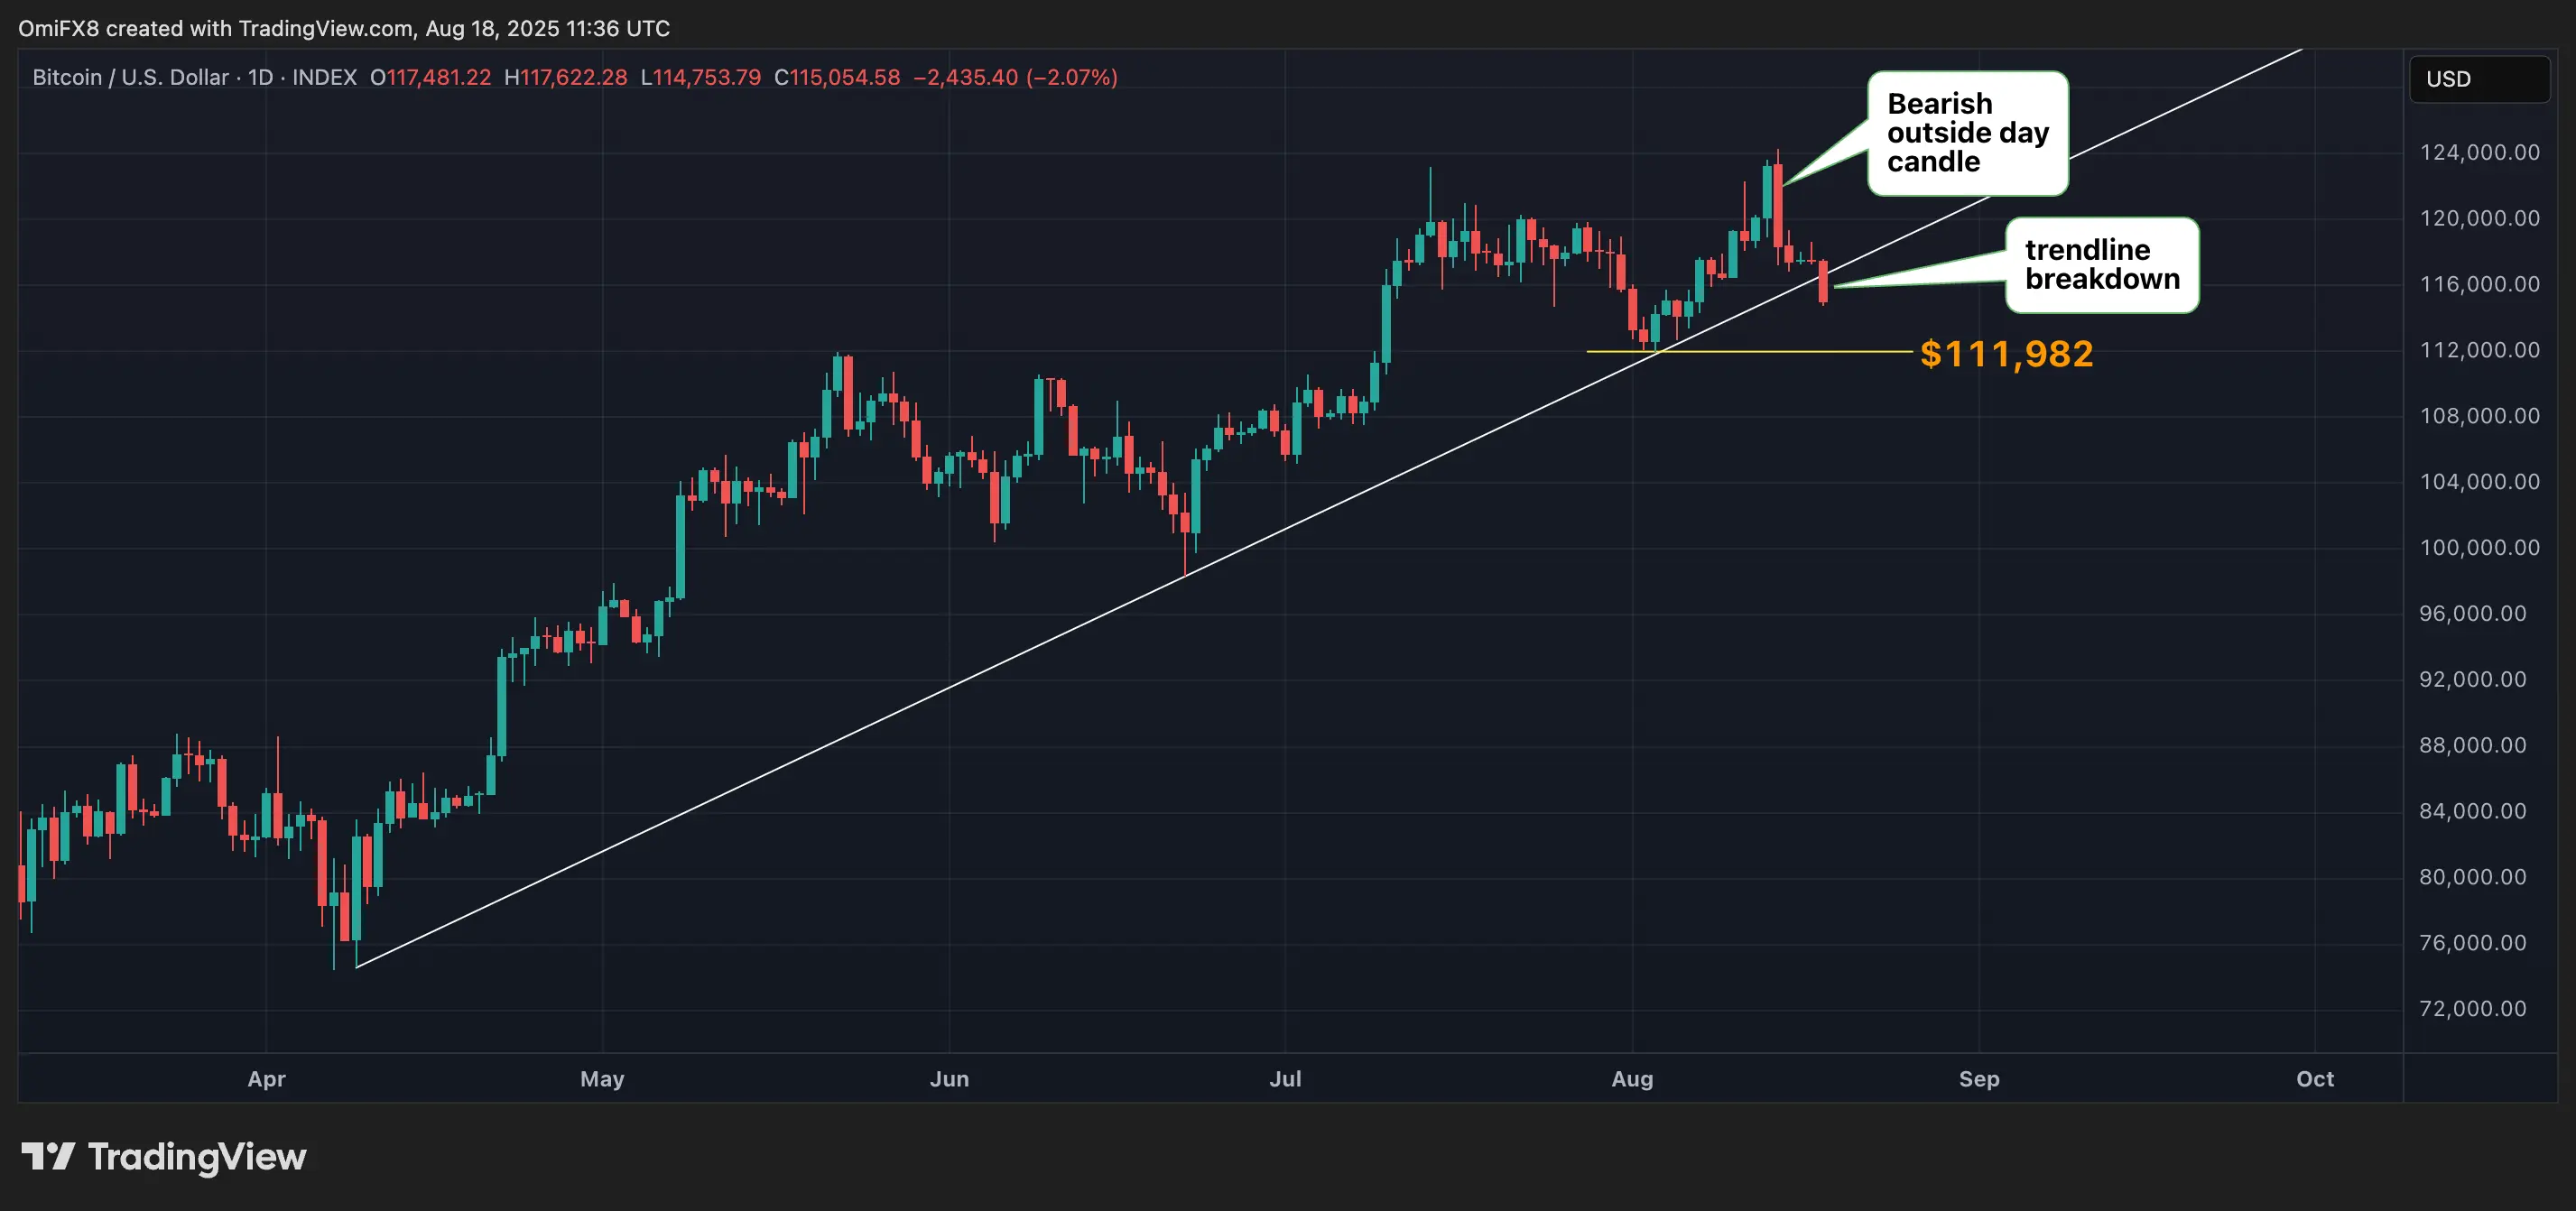
Together, these technical signals indicate an increasing downside risk for BTC in the near term, with a potential retest of $11,982, the point from which the market turned higher on Aug. 3. A violation of this level would shift focus tothe 200-day simple moving average at around $100,000.
A potential reversal higher to above $118,600 (Sunday’s high) during the day ahead would weaken the bear case.
- Resistance: $120,000, $122,056, $124,429.
- Support: $111,982, $105,295 (the 31.8% Fib retracement of April-August rally), $100,000.
🔗 You Might Also Be Interested In
CFTC’s Goldsmith Romero says commissioner exodus ‘not a great situation’
Ether Eyes Biggest Monthly Gain Since 2022 as ETFs, Corporate Treasuries Drive Rally
Here’s what happened in crypto today
💡 Stay updated with the latest cryptocurrency news and insights by following our website! 🔔 Bookmark this site to get first-hand blockchain and digital currency news!